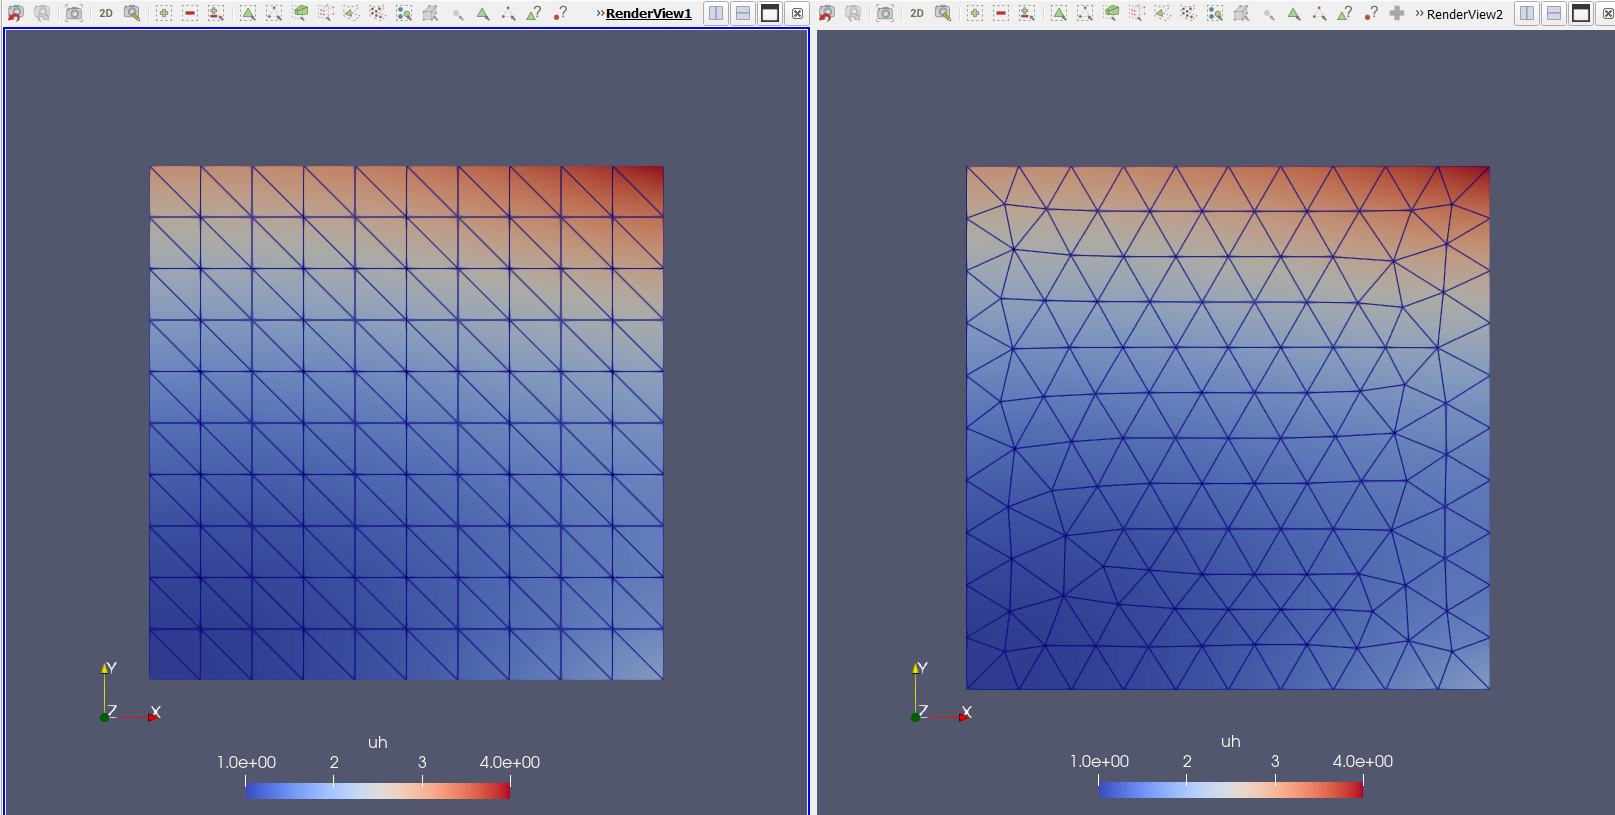
Visualization over different meshes
Once you have the same domain but with different meshes, often is neeeded a comparison between the 2 solutions. mesh.
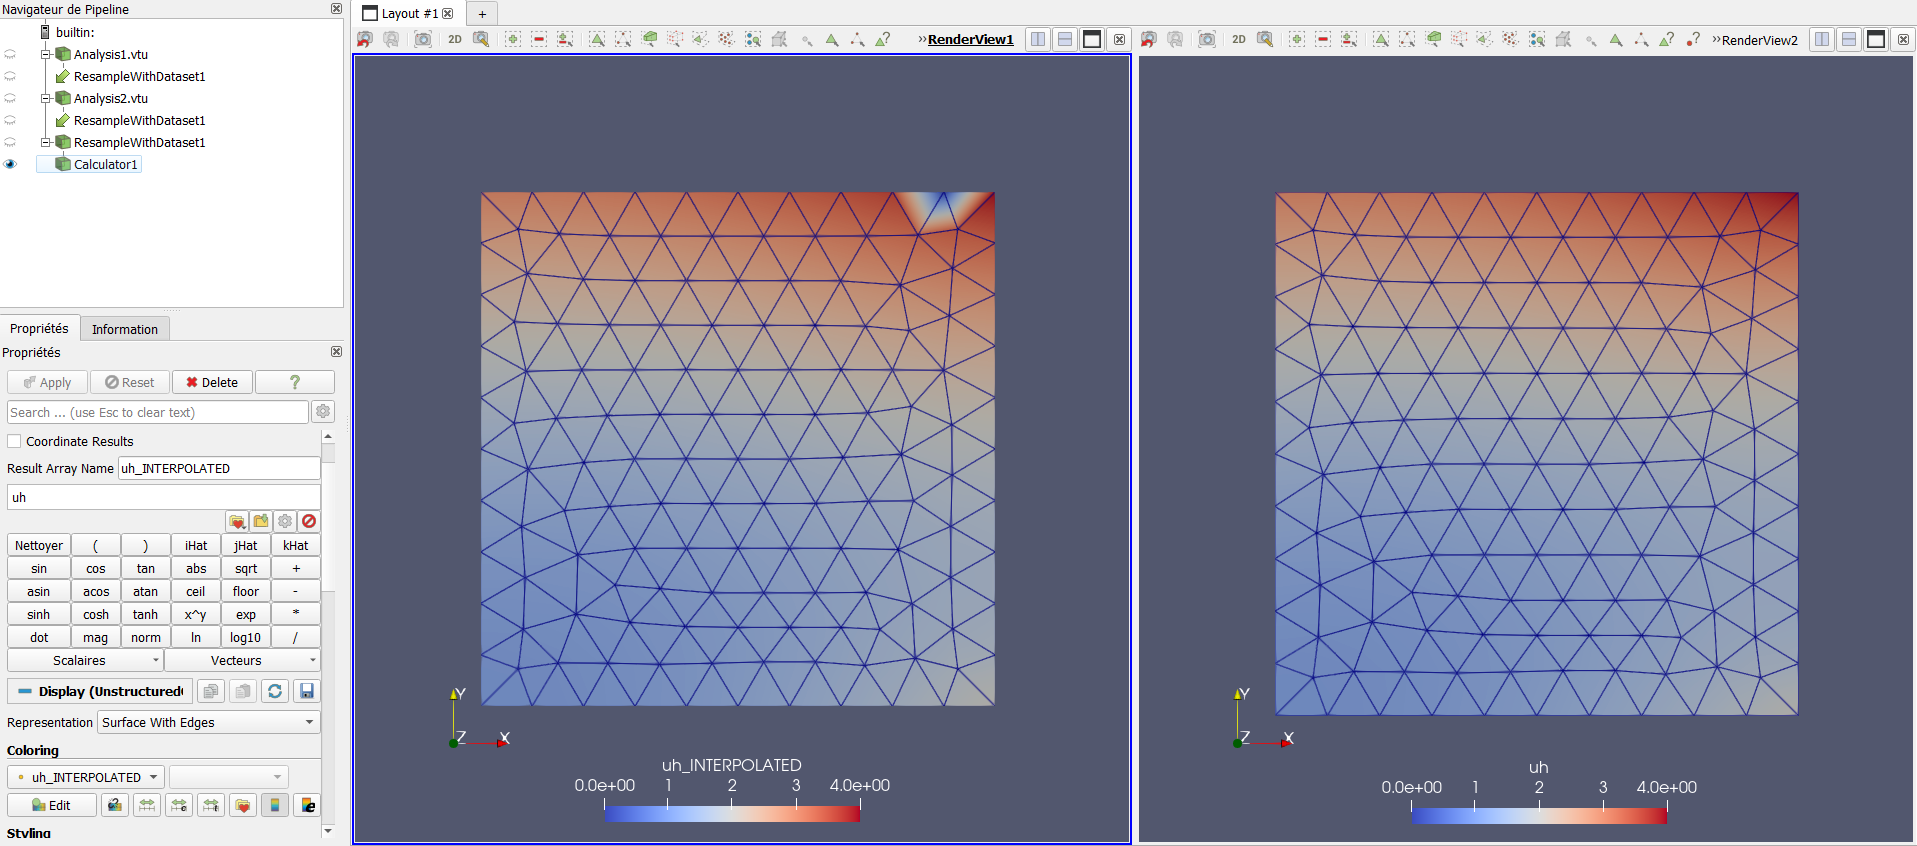
The filter (shortcut Ctrl + space-bar) Resample with Dataset provide a way to interpolate result into a different
Check data over a line
Often it is necessary to display varibale trend over a line. Using the shortcut Ctrl + space-bar
you can rise the filer menu and type Plot over line This will ask to draw a line which is dificult to place.
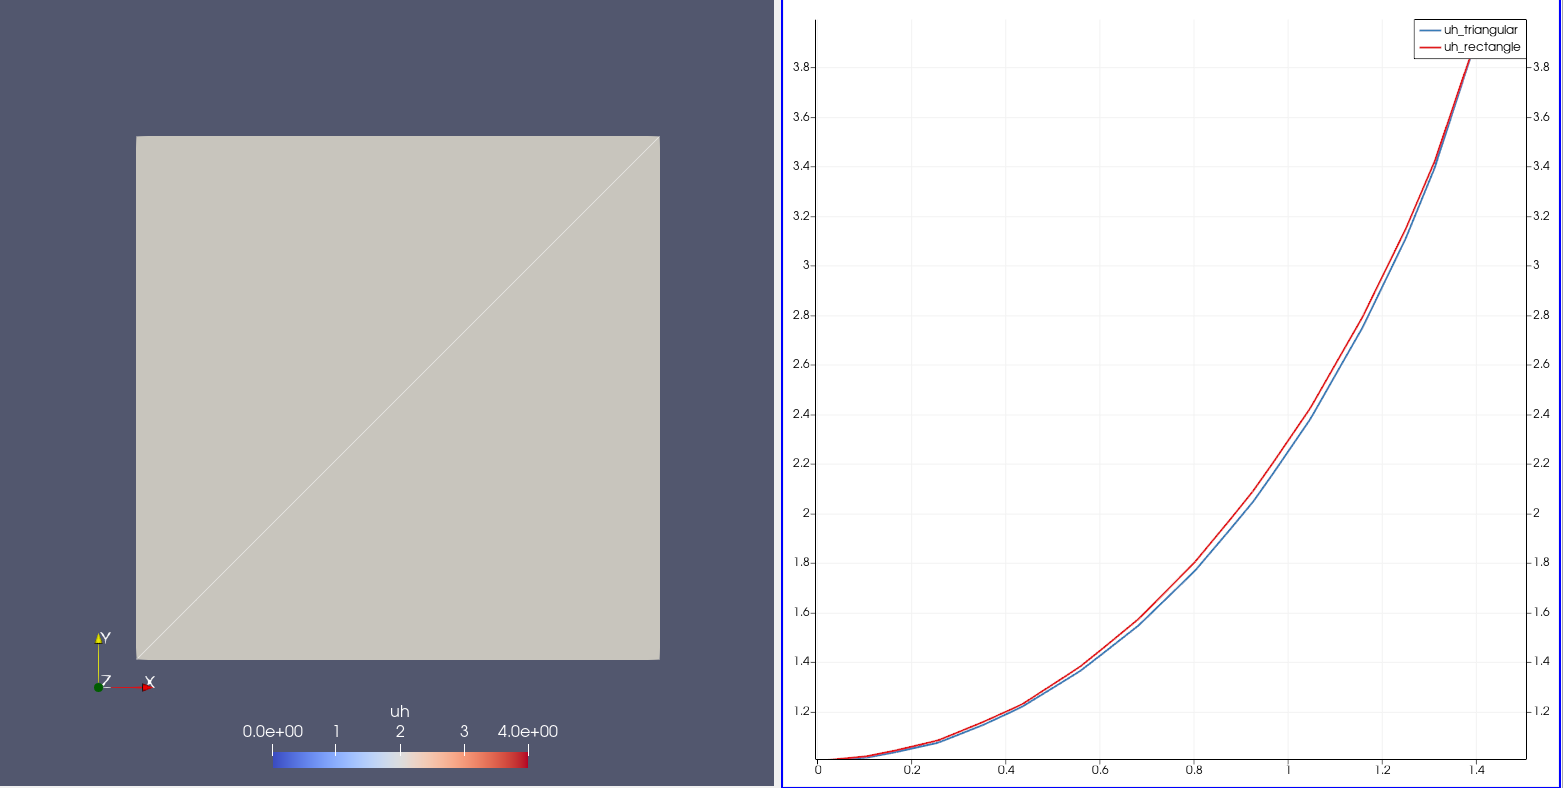
The best way to use plot over line is through slicing the domain and the slice again the 2D plane on the location of interest. The filter will automatically recognize the 1D domain resulted by the interesection of two planes.